Overdetrmind system and Underdetermined system
- Overdetermined system: A system of equations that has more equations than unknowns(row > col). It may have no solution or an approximate solution.(Least Squares Method)
- Underdetermined system: A system of equations that has fewer equations than unknowns(col > row). It may have infinitely many solutions.(Gaussian Elimination)
Example: Line fitting (Linear Regression)
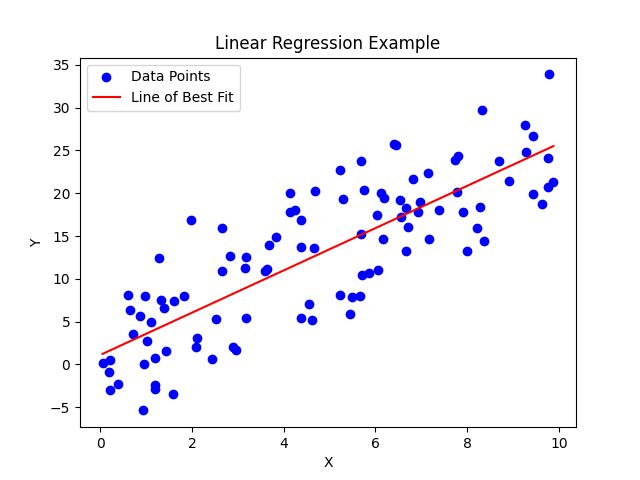
- Generally, we often run into the problem that we have more than two points and try to represent out points with one straight line. However, the data points do not lie on a straight line. We can try infinitely many straight lines to fit all the data points. Under this situation, the problem of least squares is to find the line that fits the data the best. This is called linear regression.
- The best fitting line is often called the least squares line or the regression line.
- Residual: The directed didstances between the observed data points and the corresponding points on the model is called Resudual.
- To obtain the best fitting line, we need to minimize the sum of the squares of the residuals.
- Example:
Least Squares Method (Overdetermined System)
-
The least squares method is a mathematical procedure for finding the best-fitting curve to a given set of points by minimizing the sum of the squares of the offsets (“the residuals”) of the points from the curve.
-
The method is applicable to the case of overdetermined systems.
-
The method is used in regression analysis to approximate the solution of an overdetermined system.
-
The method is also used in the curve fitting.
-
The method is used in the field of statistics to estimate the parameters of a model.
-
-
-
Example: 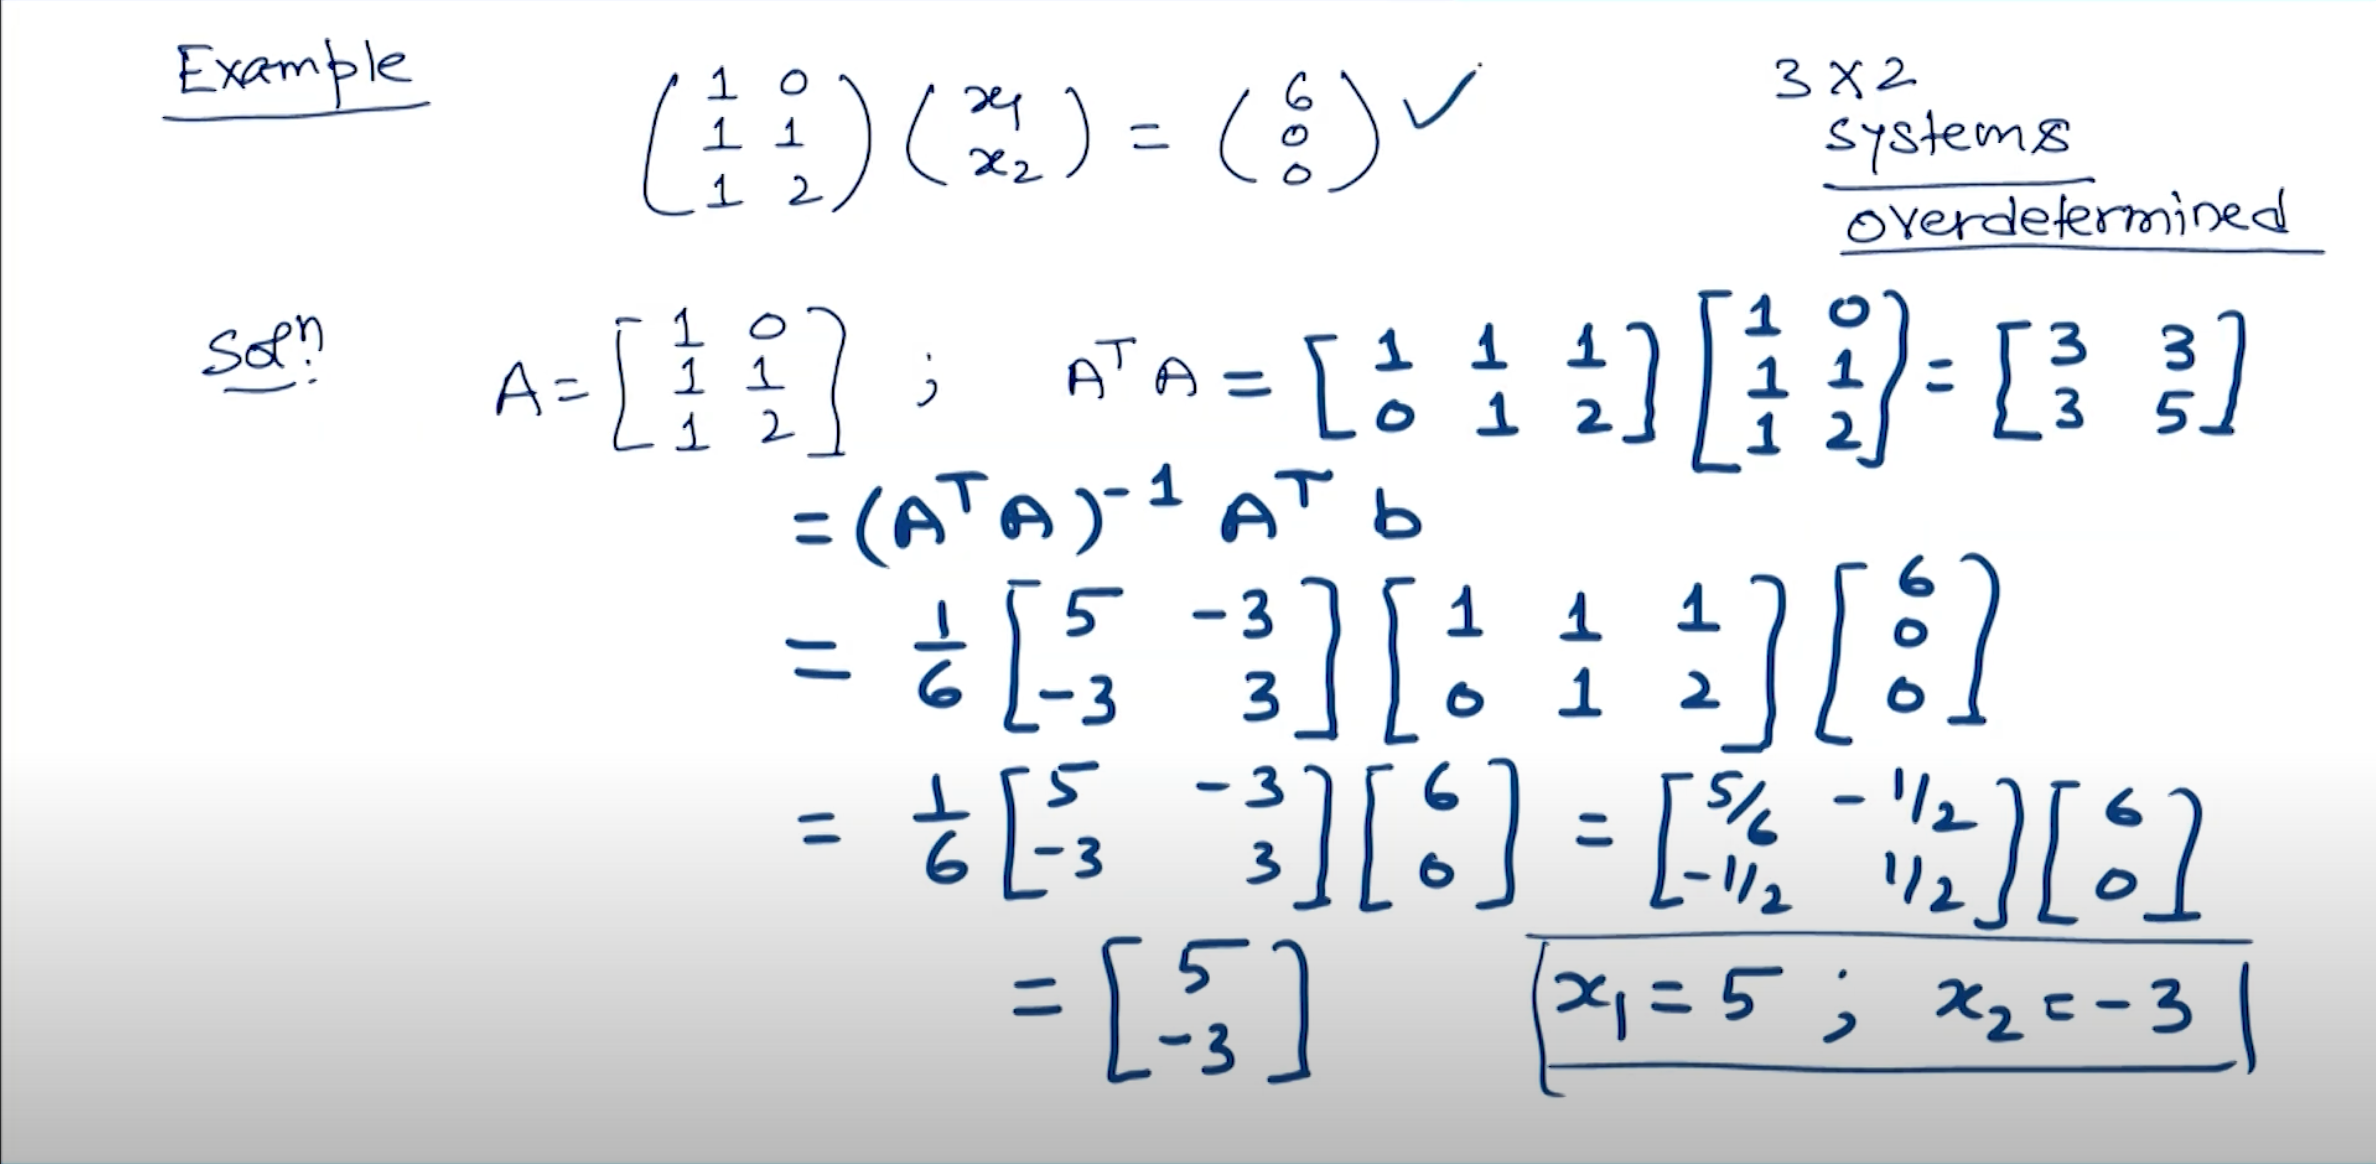
Minimum Norm Solution (Underdetermined System)
-
The minimum norm solution is a mathematical procedure for finding the solution of an underdetermined system that has infinitely many solutions.
-
The method is applicable to the case of underdetermined systems.
-
The method is used in the field of statistics to estimate the parameters of a model.
-
The method is used in the field of optimization to find the minimum norm solution of a system of equations.
-
-
-
-
(Left Pseudo Inverse)
-
Example: 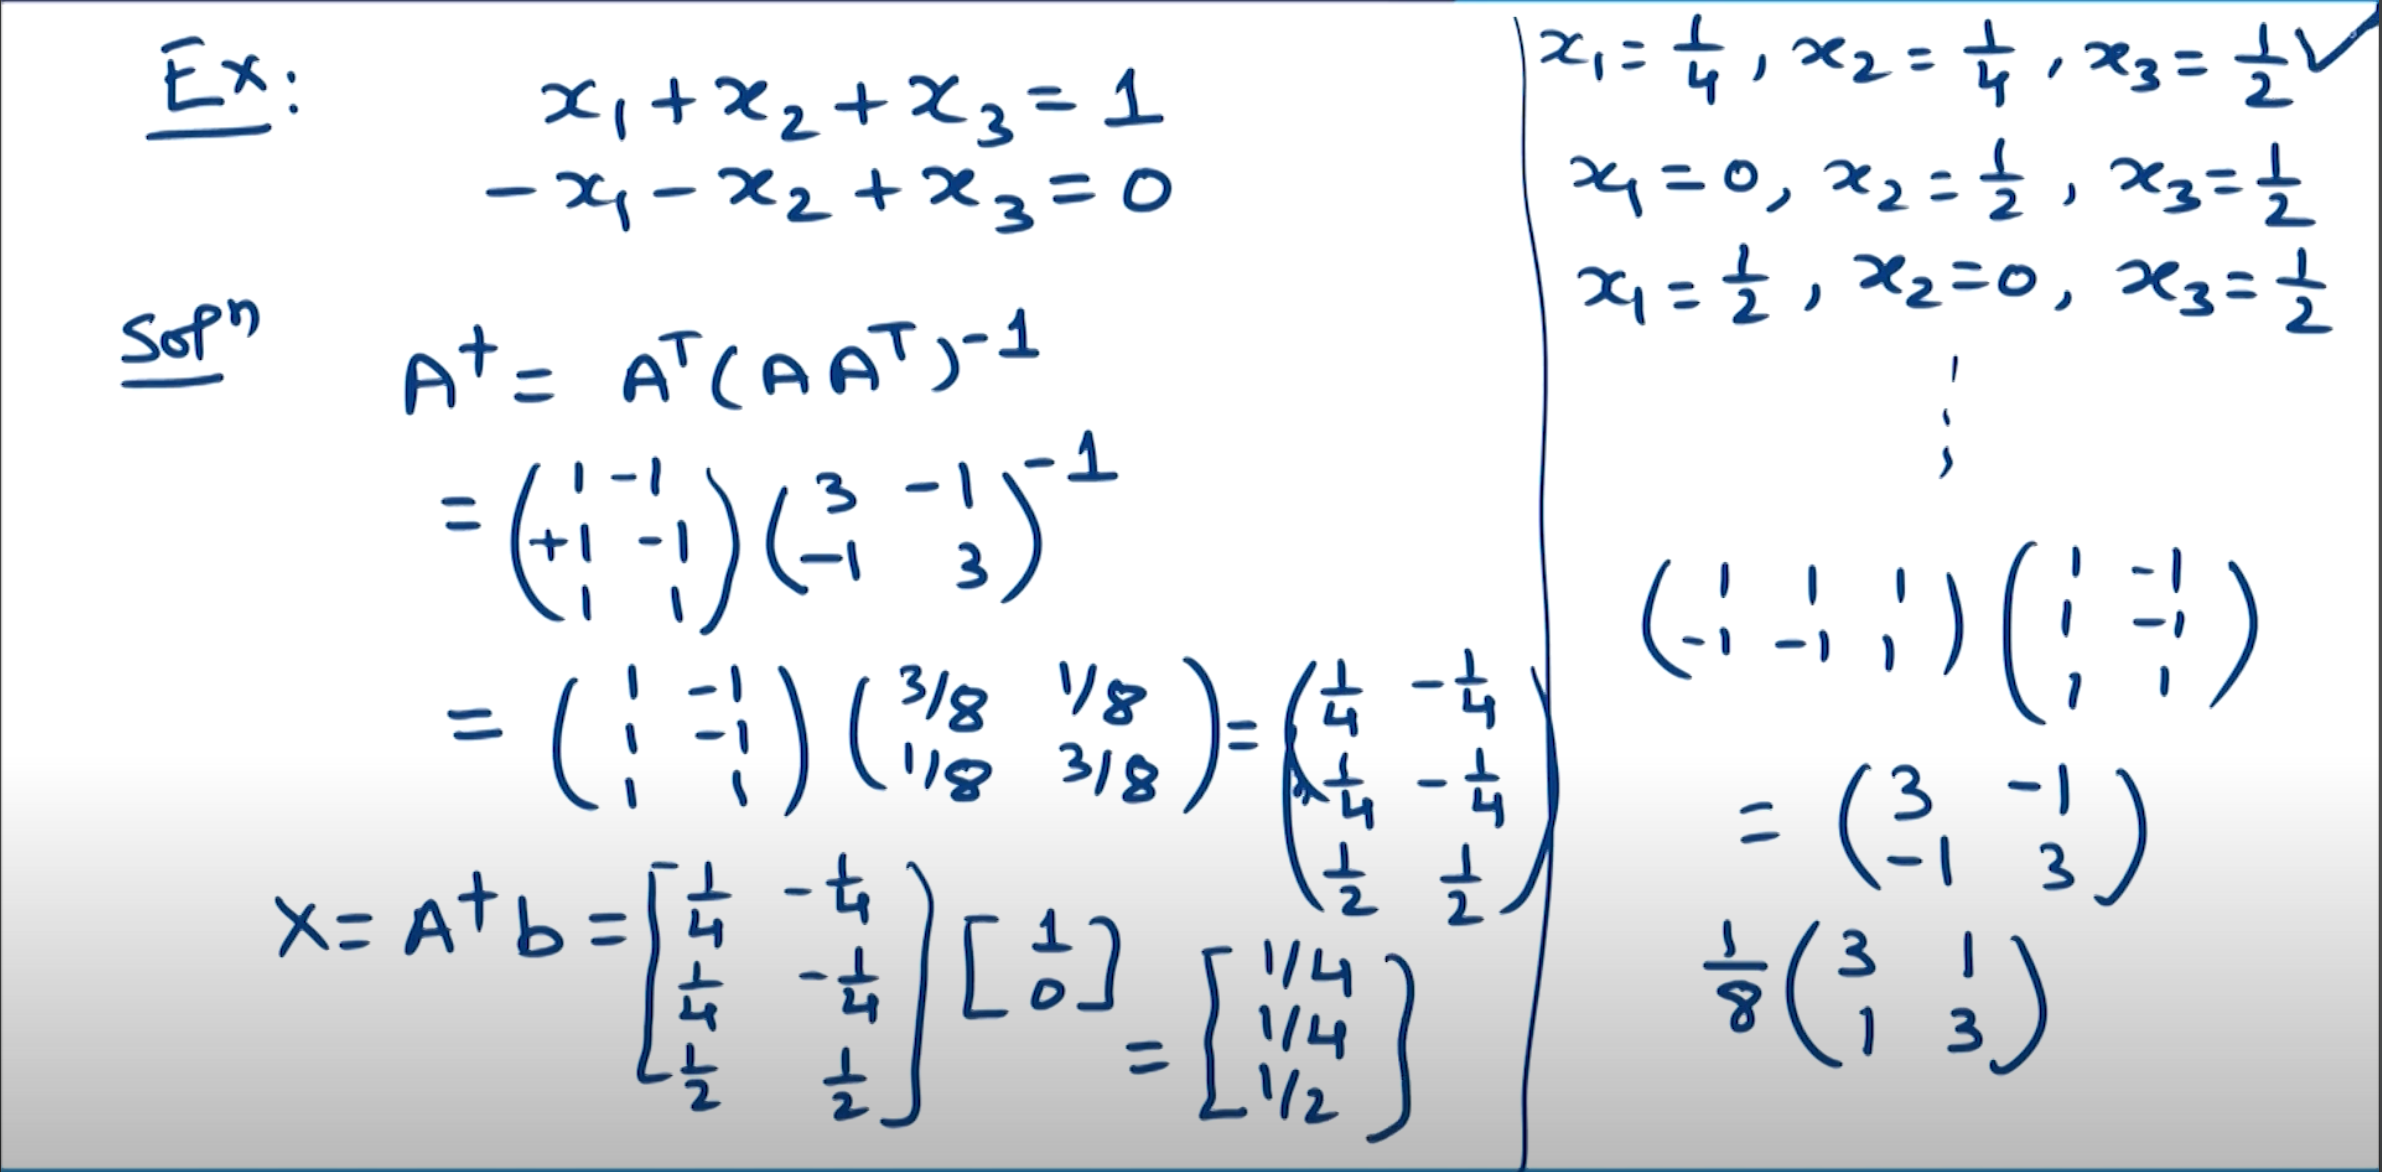
Regression
- Regression refers to the problme of learning the relationships between some (qualitative or quantitative) input variables and a quantitative output variable . Means, regression is about learning the model such that where is the error term.
Example: 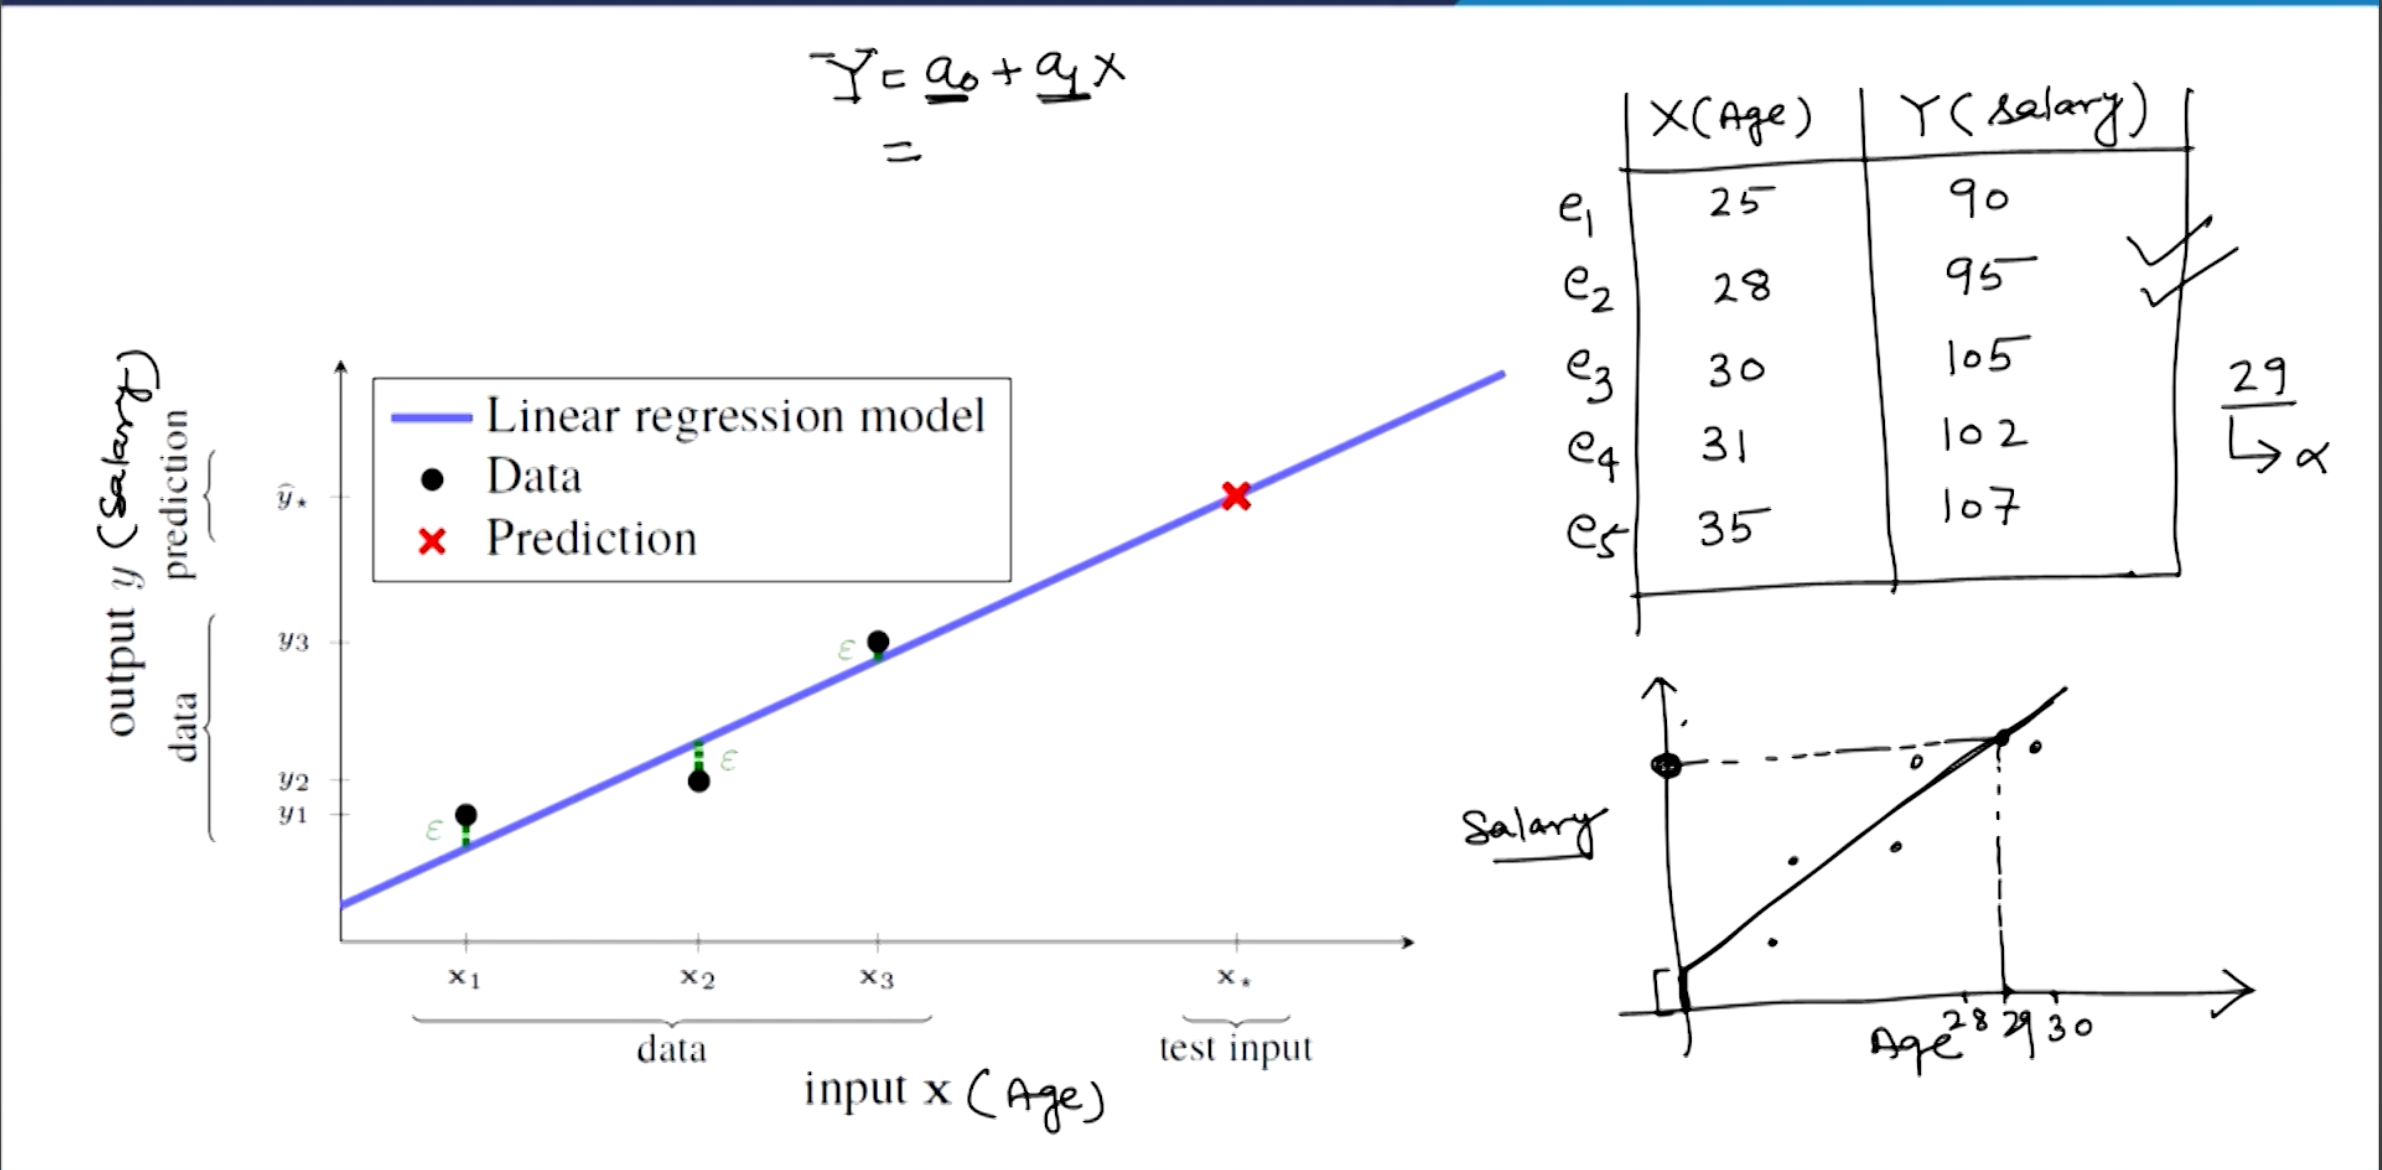
Linear Regression/ Multiple Linear Regression
- The linear regression model describes the output variable (a scalar) as an affine combination of the input variable (each a scalar) plus a noise term . where, are the parameters of the regression model which we needs to estimate based on the given data.
Calculus Approach
- The linear regression model can be represented in matrix form as where, is the output variable, is the input variable, is the parameter vector and is the error term.
- The parameter vector can be estimated by minimizing the sum of the squared errors between the observed output variable and the predicted output variable .
- The sum of the squared errors can be represented as where, is the observed output variable, is the observed input variable and is the parameter vector.
- The parameter vector can be estimated by solving the normal equation
Fitting Evaluation: Mean Squared Error (MSE) and Root Mean Square Error (RMSE)
- The mean squared error (MSE) is a measure of the quality of an estimator. It is always non-negative, and values closer to zero are better. where, is the observed output variable and is the predicted output variable.
- The root mean square error (RMSE) is the square root of the mean squared error. It is always non-negative, and values closer to zero are better.
Goodness of fitting
- The goodness of fitting is a measure of how well the regression model fits the data. It is always non-negative, and values closer to one are better. where, is the sum of the squared residuals with & and is the total sum of squares with only.
Score
- We have .
- If , then is not useful.
- If , then fits all the points perfectly.
(Essentially the same thing happens when there is more than one independent variables.)
How large does need to be to be considered as “good”? This depends on the context, there is no absolute answer here. For hard to predict Y variables, smaller values may be “good”. For easy to predict Y variables, larger values may be “good”.
Polynomial Regression (Overfitting)
- Polynomial regression is a form of regression analysis in which the relationship between the independent variable and the dependent variable is modelled as an degree polynomial in .
Overfitting
-
Overfitting is a modeling error that occurs when a function is too closely fit to a limited set of data points. Overfitting the model generally takes the form of making an overly complex model to explain idiosyncrasies in the data under study. In reality, the data may contain some random noise that is not part of the underlying relationship.
-
Overfitting occurs when the model is too complex for the data. It is a common problem in machine learning and statistics.
-
Overfitting can be avoided by using a simpler model, using a larger training set, or using regularization techniques.
-
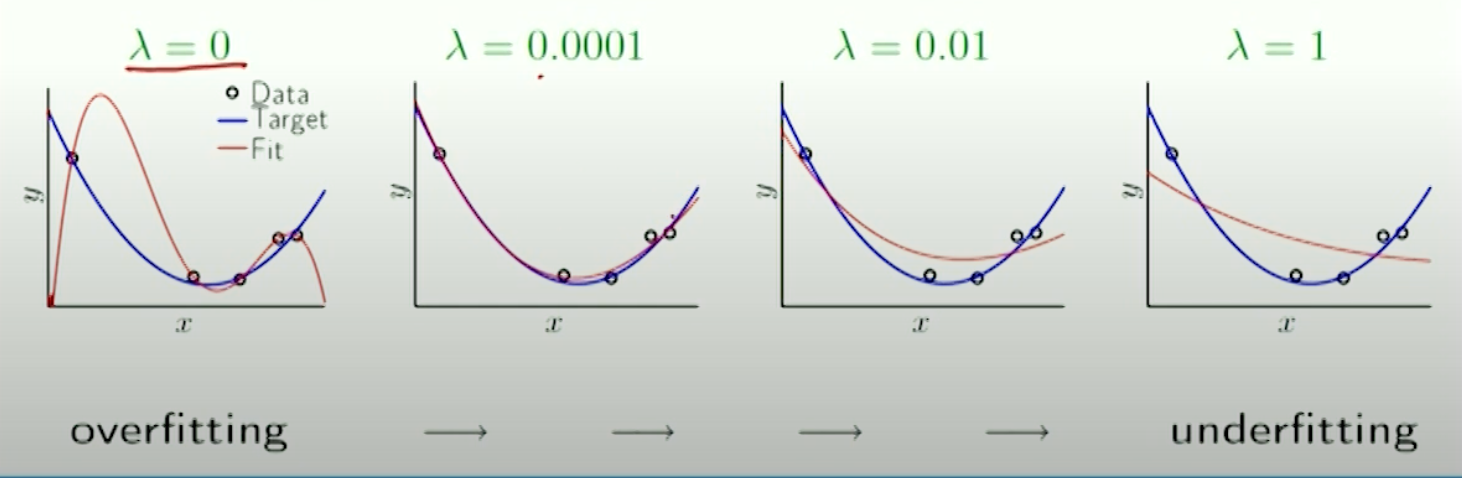
Regularization: Regularization is a technique used to prevent overfitting by adding a penalty term to the loss function. The penalty term is a function of the model parameters that increases as the model complexity increases. Regularization is used in machine learning and statistics to improve the generalization of the model.
Ridge Regression
-
Ridge regression is a regularization technique used to prevent overfitting by adding a penalty term to the loss function. The penalty term is a function of the model parameters that increases as the model complexity increases. Ridge regression is used in machine learning and statistics to improve the generalization of the model.
-
Ridge regression is also known as Tikhonov regularization or L2 regularization.
-
Ridge regression is used in linear regression to estimate the parameters of the model by minimizing the sum of the squared errors between the observed output variable and the predicted output variable plus a penalty term.
-
-
Ridge regression is similar to MLR, except that the coefficients are estimated by minimizing a slightly different quantity. where is a tuning parameter, to be determined separately.
-
The effect of this equation is to add a shrinkage penalty of the form where the tuning parameter is a positive value.
-
This has the effect of shrinking the estimated beta coefficients towards zero. It turns out that such a constraint should improve the fit, because shrinking the coefficients can significantly reduce their variance.
-
Note that when , the penalty term as no effect, and ridge regression will procedure the OLS estimates. Thus, selecting a good value for is critical (can use cross-validation for this).
Lasso Regression
-
Lasso regression is a regularization technique used to prevent overfitting by adding a penalty term to the loss function. The penalty term is a function of the model parameters that increases as the model complexity increases. Lasso regression is used in machine learning and statistics to improve the generalization of the model.
-
Lasso regression is also known as L1 regularization.
-
Lasso regression is used in linear regression to estimate the parameters of the model by minimizing the sum of the squared errors between the observed output variable and the predicted output variable plus a penalty term.
-
Lasso regression is similar to ridge regression, except that the penalty term is the absolute value of the model parameters instead of the square of the model parameters.
-
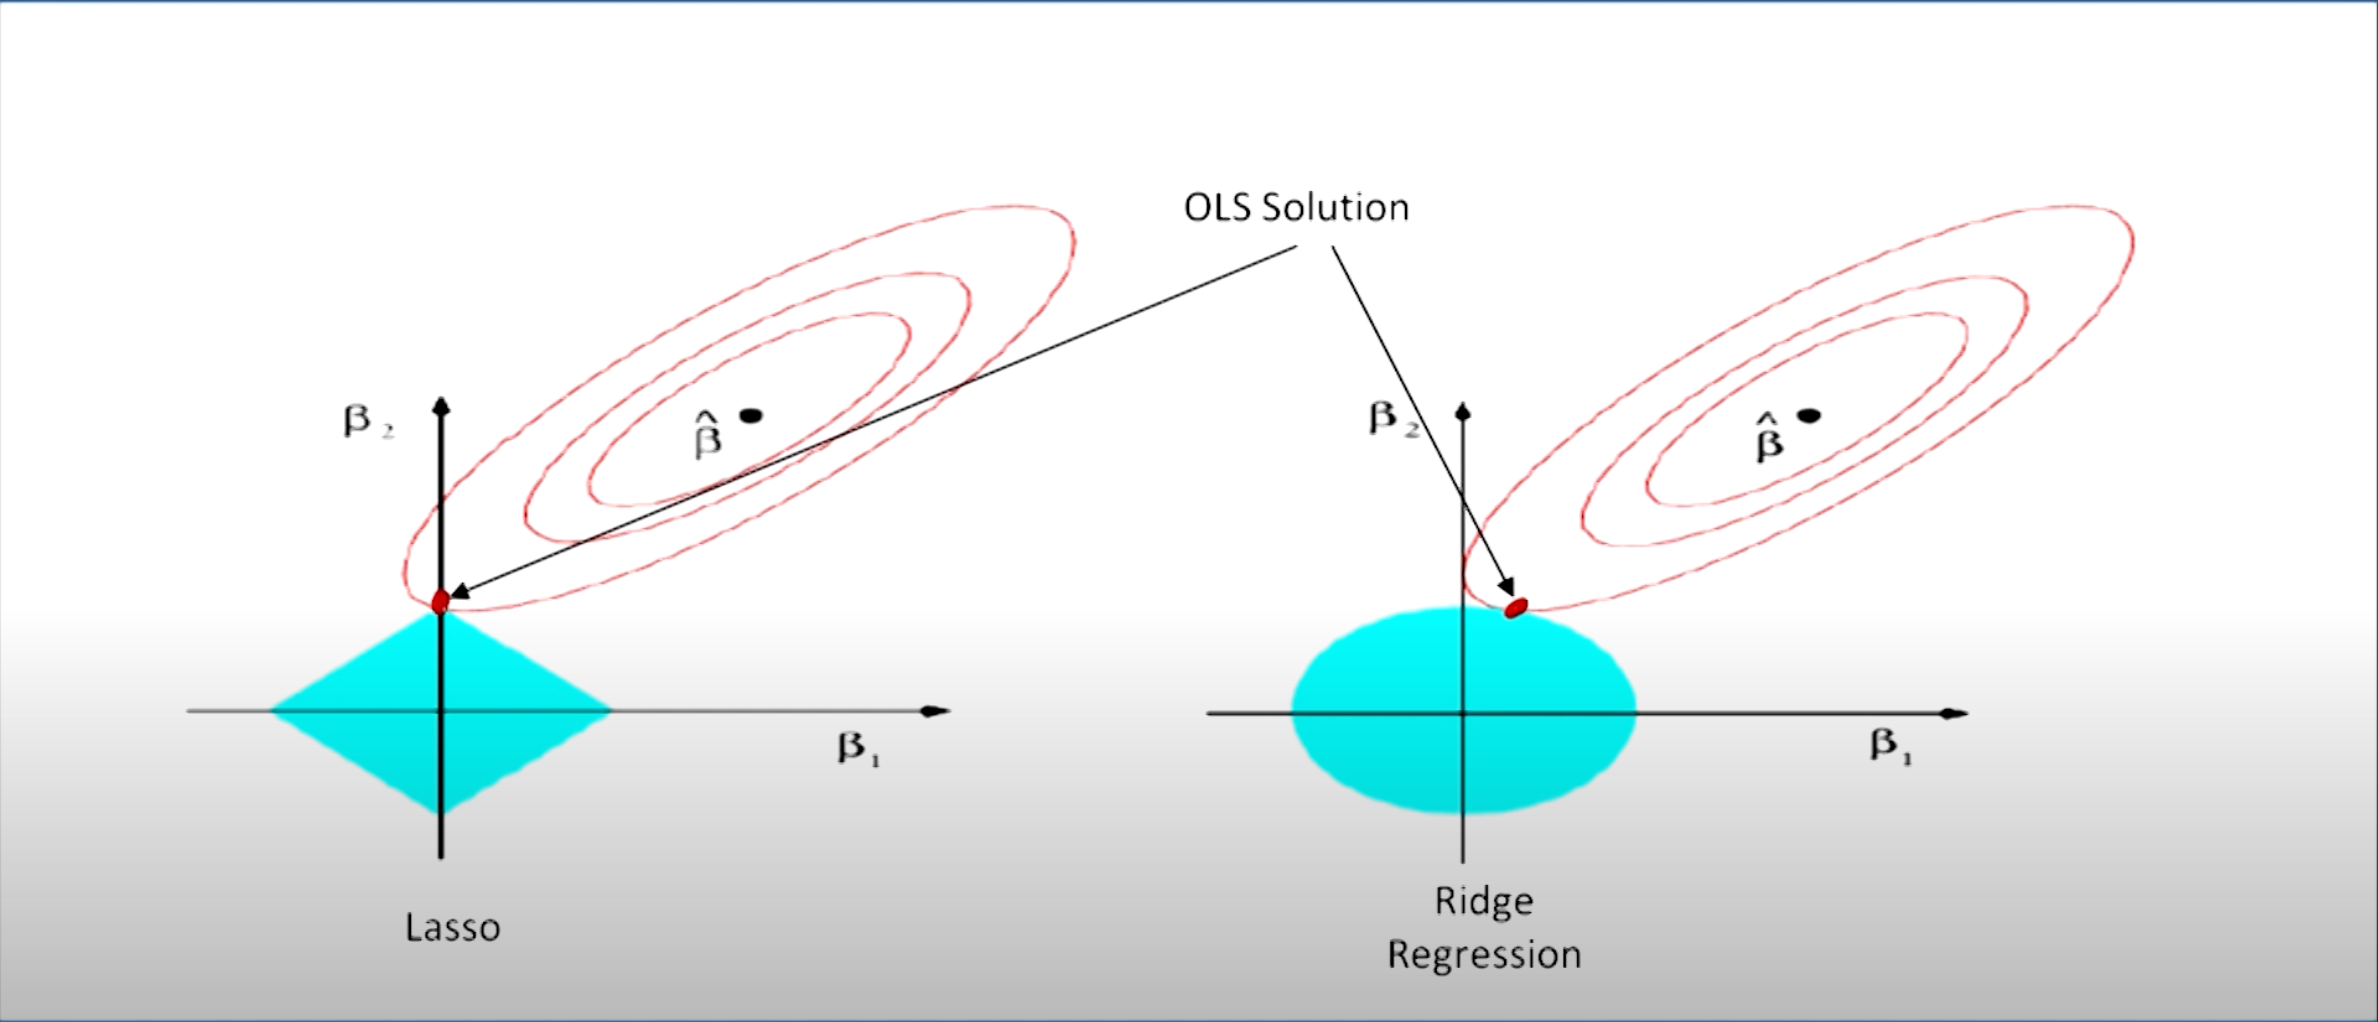
One significant problem of ridge regression is that the penalty term will never force any of the coefficient to be exactly zero.
-
Thus, the final model will include all p predictors, which creates a challlange in model interpretation.
-
A more modern machine learning alternative is the lasso.
-
The lasso works in a similar way to ridge regression, except it uses a different penalty term that shrinks some of the coefficients exactly to zero.
-
The lasso coefficients minimize the quantity:
-
-
The key difference from ridge regression is that the lasso uses an L1 penalty insted of an L2, which has the effect of forcing some of the coefficients to be exactly equal to zero when the tuning parameter is sufficiently large.
-
Thus, the lasso performs variable/feature selection.
Colab Example
Logistic Regression
Sigmoid Function
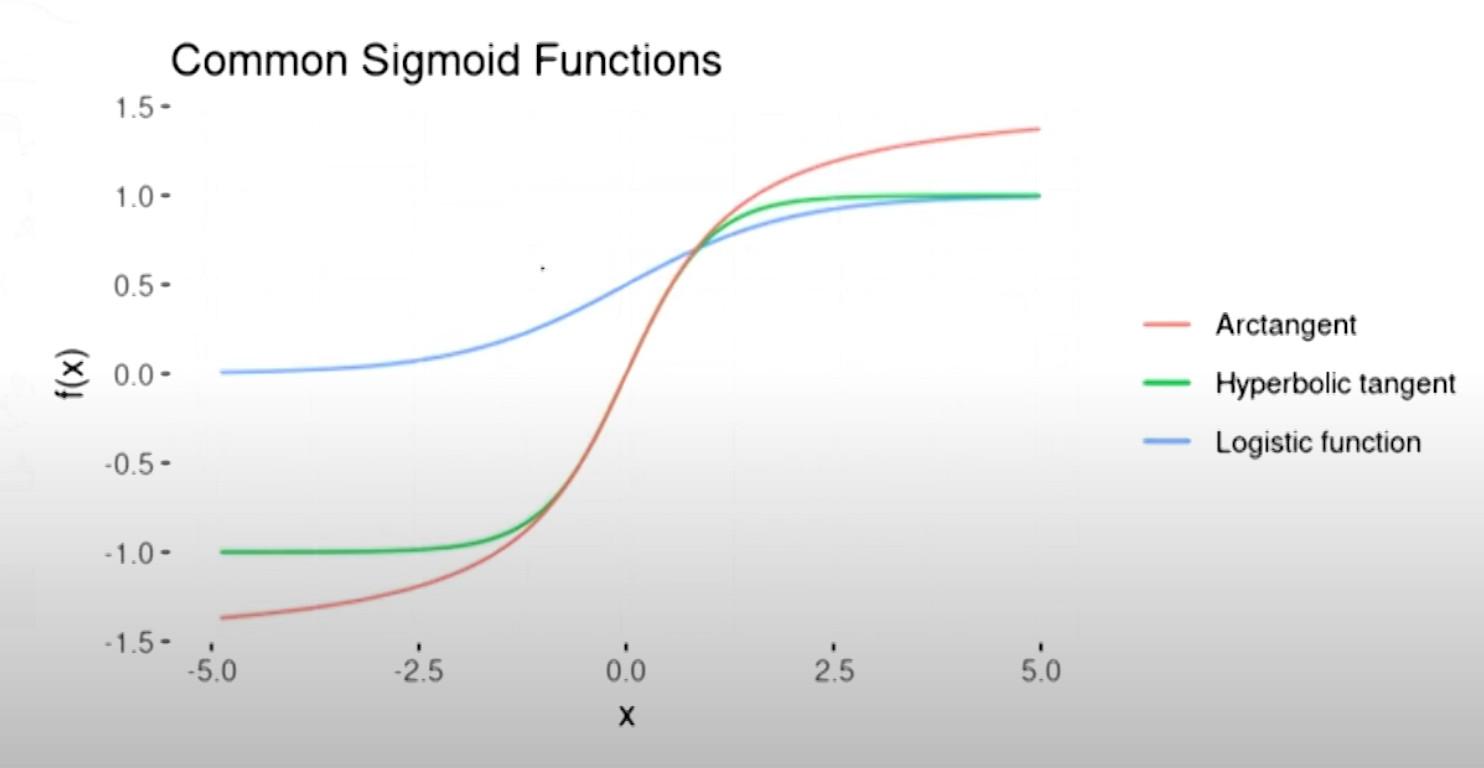
- A Sigmoid function is a mathematical function which has a characteristic S-shaped curve.
- Logistic function
- Hyperbolic tangent function
- Arc tangent function
Properties of Sigmoid Function
- The sigmoid function is a bounded, differentiable, and monotonically increasing function.
- The sigmoid function is symmetric about the origin.
- The sigmoid function is a continuous function.
- Range of the sigmoid function is .
Logistic Regression
- Supervised learning algorithm used for classification.
Logistic Regression based Classification
-
Logistic regression becomes a classification technique only when a decision threshold is brought into the picture. The setting of the threshold value is a very important aspect of Logistic regression and is dependent on the classification problem itself.
-
binomial: The target variable has only two possible outcomes such as Spam or Not Spam, Cancer or No Cancer.
-
multinomial: The target variable has three or more categories such as predicting the type of Wine.
-
Ordinal: The target variable is ordinal such as movie rating from 1 to 5.
Probability Basics
- Sample Space (): It is the set of all possible outcomes of an experiment.
- Event: It is a subset of the sample space.
- Probability of an Event: It is the likelihood of the occurrence of an event.
- Probability Distribution: It is a function that assigns probabilities to the outcomes of a random variable.
- Random Variable: It is a variable whose possible values are outcomes of a random phenomenon.
- We need to estimate the coefficients from the training data.
- we use the technique of maximum likelihood estimation.